

One of the crucial skills an engineer needs to acquire is the ability to succinctly communicate a design. In the early days of engineering, designs were paper-based documents handwritten by engineers and made readable by typists. Diagrams were hand-drawn by draftsman who were not necessarily project engineers. Organizations had a narrow range of visualization standards which served as a rudimentary tool for modeling. The drawings and the project documents were developed long before the review.
The computer era gave us word processing and graphics programs. Engineers were now able to communicate with electronic diagrams which also removed the typing pool and the draftsman. The data still, however, was gathered from several engineers with documents compiled and graphics developed from many different perspectives. These diagrams were not generated from a project data repository and generally didn’t reflect the actual data needed for the reviewers to evaluate a design.
At Vitech, we have evolved with the changing environment for model-based systems engineering. CORE and GENESYS—our MBSE software tools—have developed through the years to incorporate a wide range of modeling and visualization standards.
Though standards are necessary and helpful, I’ll be the first to say that they don’t always generate what is needed for your audience to understand the design you are attempting to communicate. We have all used Hierarchy, Physical Block, or SysML diagrams in the past. These are classic examples of standard diagrams. We as engineers understand what data we need to create these. Yet our audiences don’t always have our level of knowledge or understanding to relate to these depictions of our data. It’s a given that it is highly important that your audience/stakeholders/users understand the data and the relationship to the design.
Without clarity in design communication, engineers encounter endless questions on the design and where the information came from. This often leads to a number of follow-up meetings to explain the disconnects to individuals or teams, which can then result in multiple issues. No fun.
GENESYS and CORE provide both SysML and Standard views for diagrams. However, one of Vitech’s unique features, called a spider diagram—which is neither a Standard nor a SysML diagram—will sometimes help me communicate more effectively to an audience.
As described in One Model, Many Interests, Many Views, by Vitech’s Zane Scott and David Long:
The spider diagram provides a complete contextual view of a set of elements and their interrelationships. Unlike a hierarchy diagram, each entity is represented once and only once. In addition, the free-form presentation does not artificially imply a hierarchical relationship. The result is an extremely powerful representation for analysis and communication as you continue the engineering journey through systems design.
As with a hierarchy diagram, a spider diagram is based on the combination of a root element and a set of relationships. The element defines the starting point for the diagram. The set of relationships identifies which links to traverse when building the diagram. The relationships (potentially multiple) between the elements are then shown as connecting lines. The lines of convergence and divergence help identify critical aspects in the model. (p. 11)
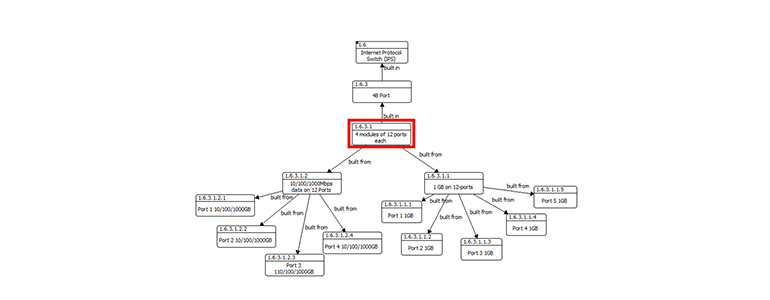
Figures 1 and 2 below are spider diagrams with the focus of the data on the center class highlighted in the red box. This allows the engineer to communicate to the audience directly from the project database. These diagrams can be used to communicate at many levels and enable the audience to focus on what is important to them.
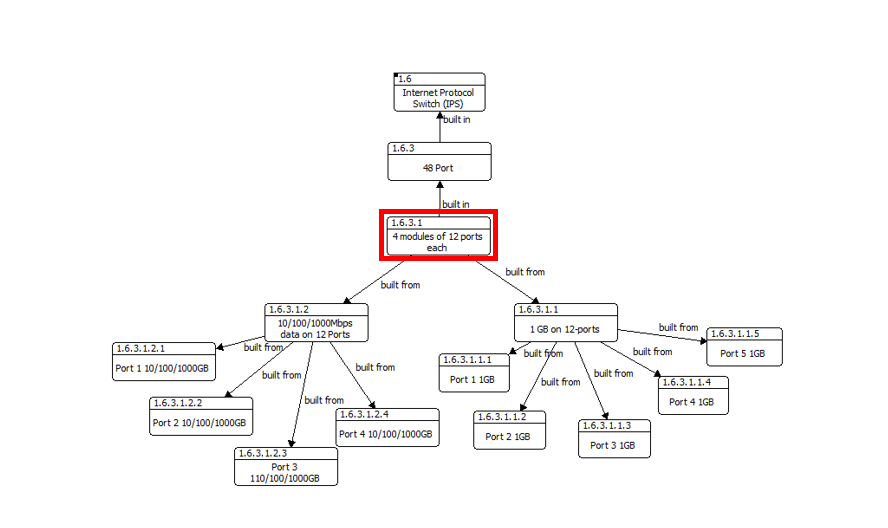
Figure 1
Figure 1 shows the relationship of a hardware component 1.6.3.1 (4 modules capability; red box) to the rest of the design. The Spider diagram can center on any design element and show how it relates to the rest of the design. This depicts what is being accounted for in the design. With the “built in” and “built from” relationships selected, the focus is from the four modules, thus enabling the diagram to depict from the top level of the rack name to the switch, modules, and the ports used as well.
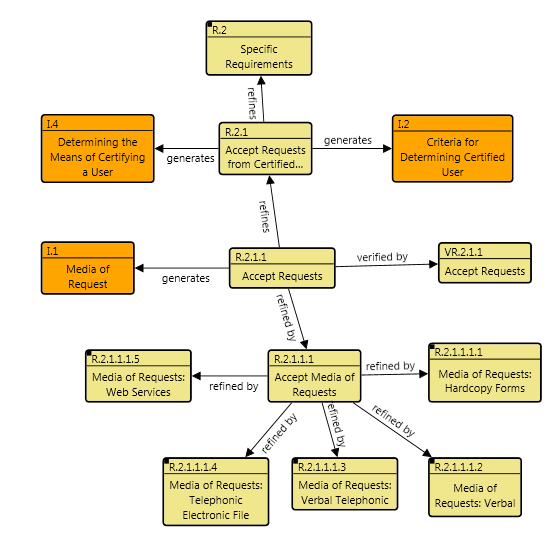
Figure 2
Figure 2 reflects the view from a requirement R.2.1.1 view (red box). This depicts what is being accounted for in the design, with the “refines,” “refined by,” “verified by” and “generates” relationships selected. The focus from the R.2.1.1 enables the diagram to depict the top-level requirement to the lowest level. With “generates” selected, it provides the review team with concerns discovered during the design period which may need resolution.
In conclusion, spider diagrams give the engineer and the audience the data to focus at any level needed to communicate the current design.


