


Recap
In part 1 of this blog, I presented an architectural object to reduce wiring in an automotive vehicle by transitioning from a centrally controlled corner management system to a distributed corner-controlled corner management system. The focus was on the physical domain impacts and I demonstrated what these systems looked like in N2 diagrams. The analysis showed that 4 controllers, a network router and 5 additional connectors were added to the systems physical design.
The Point
While the architectural objective is to reduce wiring in order to reduce weight and cost, my goal, in these two blogs, is to show you that looking only at the physical domain can lead to missing bigger impacts in the behavioral domain. Part 2 focuses on the behavioral impacts and what the functional architectures look like in N2 diagrams.
Limitations
While an architectural difference of this type can be quite large, I have chosen to keep the system and its analysis relatively simple for the purposes of demonstrating the point. Specifically, in this example, I have only chosen to look only at the behaviors related to the immediate signals tied to the sensors and actuators in the system. This ignores the added complications related to the distribution of power across the system. I think you will see that there are enough complications added without considering the power to get the point.
Behavioral Domain
In the behavior domain, I have created functions for each of the sensors, actuators, the electronics that interface with them, and the software that ultimately utilizes and transforms the data from inputs to outputs. I have kept these at a conceptually high level. What I have done differently that is unique is to call out functionality related to wiring harnesses. I have done this because a systems behavior emerges from the interactions of the components and I want to point out the number of interaction differences in the two architectures.
You might be saying that there is no functionality in wiring harnesses. But, that is not true. Wire harnesses transfer electrical signals. They have an input and an output. The transfer of these signals should be straightforward but we often run into issues with getting them transferred correctly. Primarily electro-magnetic interference disrupts the ability of the harness to transfer the signals cleanly. When this happens, one or more of the interactions between parts of the system has been affected and the behavior of the system changes.
Centralized System
The N2 diagram below depicts the functionality that I have defined for the centralized system. The functions are shown down the diagonal of the diagram. The input and outputs of functions are off the diagonal and are at the intersection of input and output functions. The outputs are represented in the horizontal arrows from a function and inputs in the vertical arrows to a function. Inputs and outputs outside the diagonal are coming from or going to elements outside system and there is no flow depicted in the diagram. Any flow is only inferred by the author or reader.
I realize that the diagram may not be readable in this format but here is the simple analysis. The diagram shows that there are 27 functions identified down the diagonal and 68 exchanges between the functions. This includes the inputs and outputs of the system. When describing behavior, I use functions to define the specific actions that an element/part of the system is doing. The true behavior is really in the observables (outputs) and the functions are what do the transformations to create the behavior.
Distributed System
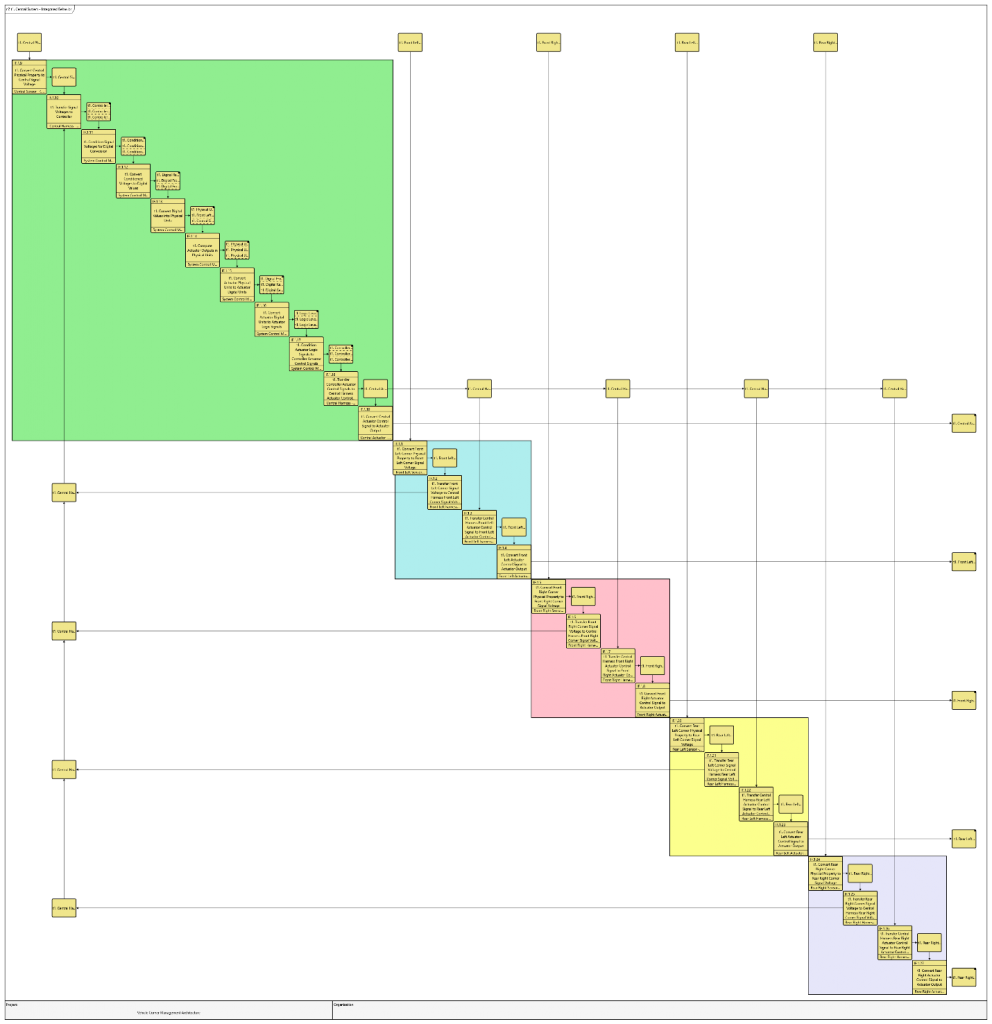
Here is what the N2 diagram looks like for the distributed system.
![]()
This diagram may appear even more unreadable. That is because I have expanded the functions from 27 functions to 74 and the exchanges from 68 to 100. This really is not a fair comparison by numbers. I did take some liberties in the centralized system of combining some of the functions.
The Real Analysis
I have highlighted the functions on the diagonal in white boxes indicating where functionality is the same or the same and just distributed across controllers. I have also highlighted in grey where the functions are the same but have been slightly modified. And finally, I highlighted the exchanges that are new in light blue. What the analysis exposes is that there are 20 new functions, 10 modified functions, and 32 new exchanges. This is illustrated in the expanded view of the upper left corner box from the larger N2 diagram.
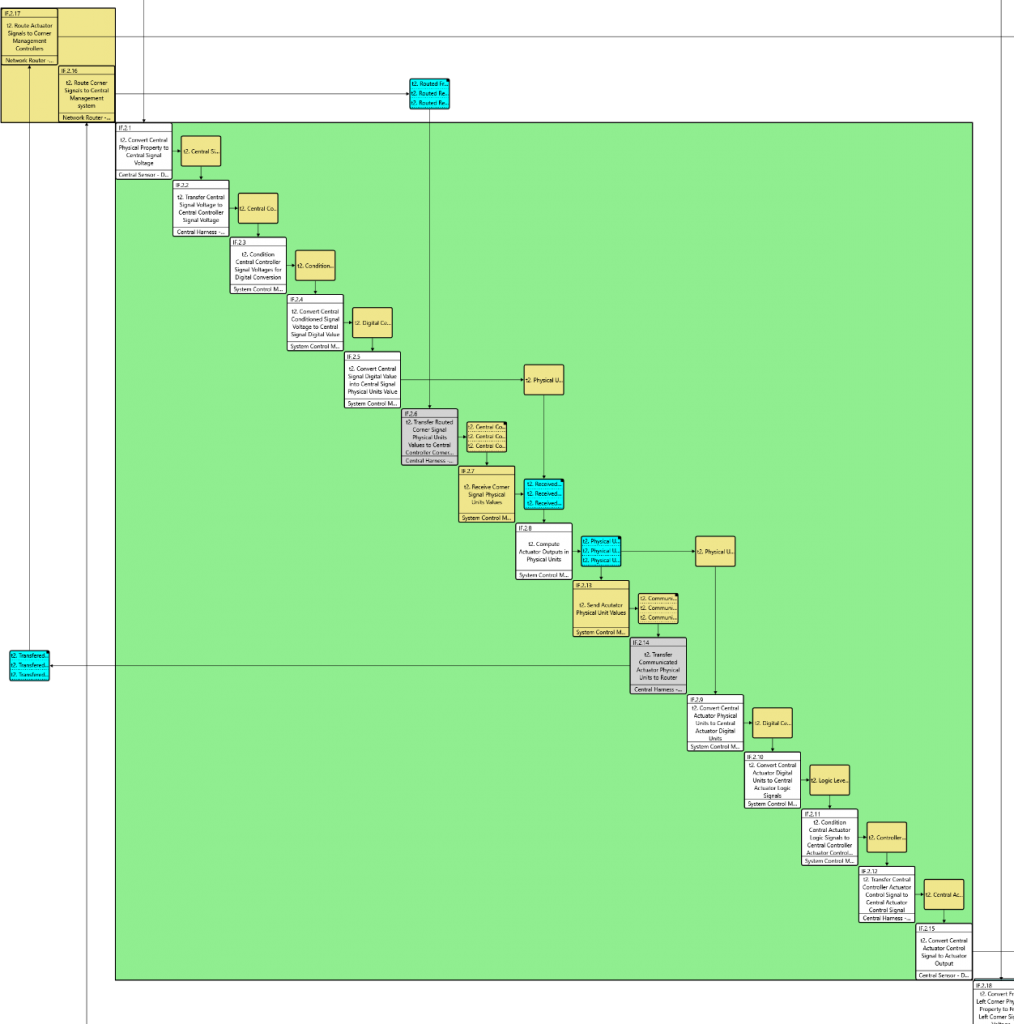
So, while the part count difference is 5 and there are 5 additional mating connectors, the behavioral impacts across the parts are more significant with the addition of 20 functions and 32 exchanges. The question we really need to be asking ourselves in the analysis is whether the additional complications of the design are significant enough to outweigh the benefits of reducing wiring weight and cost. Every exchange in a system is an opportunity to inject failure modes. Every function, component, and connector are opportunities to introduce defects that can cause additional failures. The question really comes down to the reliability impacts these changes may have. Do the reliability impacts have more significance than the weight and cost of the wire?
Take Away
My experience has been that we often only look at the physical domain when doing impact analysis for changes. As I think you can see, the value of analyzing your system impacts from both the physical and functional domains. And while there are many ways to communicate, I hope that I have given you another tool in the N2 diagram and how it can be used to communicate this type of information. Happy architecting!


