

As a freelance writer, my wife can often be overheard stressing about “art.” According to her philosophy, the graphic for a story can either make or break how the piece is perceived by readers. It’s even more important for online media today, where authors get a one-shot deal at a graphic that appears at the top of the page, setting the tone for the whole shebang. The days of print media and the opportunity to publish a myriad of photos to round out the story are in the rear-view mirror.
Several years ago when I worked for another company, Susan was helping me with a very large proposal for Department of Defense work, mainly in paring down superfluous wording. The document I was working on went with a 60+-slide presentation to a client. While I did not work for Vitech then, I was relying almost exclusively on visuals from CORE, and as we worked to make the language more concise, my wife remarked, “You know, these are really quite good. It’s scary, but I feel like I actually could understand the technical part of all this!” This from someone who is always making jokes about the boring job of an engineer and our lack of creativity.
I explained to her that my discovery of CORE and the visuals it’s able to generate answered all the needs of the project, and further, that it was not the first time I had used it in presentations on model-based systems engineering (MBSE).
In preparing proposals involving MBSE, one has a brief window of time to convince a client that (a.) he has a thorough understanding of MBSE, and (b.) he has a tool to design and bring the project to completion. Of supreme importance in an extremely competitive market is the ability to create diagrams which convey these capabilities. Vitech’s CORE and GENESYS both more than fit the bill. Think of it as software that does double duty. It creates the important visuals which show the contractor/client what you can accomplish, and then, once the contract is accepted, it helps you fulfill the promise.
CORE’s visuals work even if the known data is on the light side. For example, if you only have a simple OV (Operational View), you can still create a proposal for a client using CORE, either with its embedded information which creates diagrams using the known data, or by importing whatever graphic you desire. This tool works for the most part in reverse, from what you know to what you don’t know, allowing an engineer to find the missing links and create the finished visual/project. To state it simply— pictures are created which communicate the status of the project all along the way.
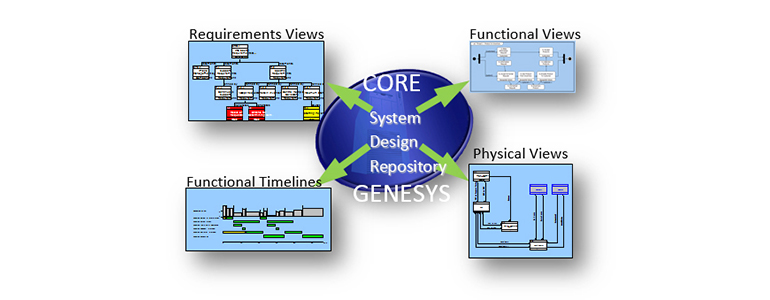
Vitech’s approach features a repository, capturing information in a single place, while enabling the generation of an array of views from the model. Model views can include DODAF (Department of Defense Architecture Framework), SysML (Systems Modeling Language), IDEF (Integrated Definition), and a variety of other engineering views. Practitioners can review technical content from the model and make changes to the underlying data, which is then reflected on all associated views. They can even accomplish this by making changes to a view in the model, and then see the changes reflected in the other views as they are generated by the tool.
Compare this feature to editing an individual view with one of the drawing tools out there on the market; such an approach raises the potential of inconsistency with the data presented on other views. Drawing tools make things easy to add to an individual view, but they miss what a system engineering tool provides—the real data which has already been accounted for and ingested into the overall design.
One of my favorite diagrams early in the development phase of a project is the Hierarchy Diagram. This allows an engineer to review functions traced to requirements or requirements traced by functions. This is the beginning of the project analysis and is a crucial visual that portrays this back and forth relationship.
CORE’s visuals help an engineer with the answers needed in the very beginning. When preparing a proposal, I always demonstrate this function. For example, if there is a requirement showing no “basis of” function, an engineer would know to immediately ask “Why?” This is not something you would readily pick up reading a specification, but the visual in CORE will reveal this right away. Even more important, the created graphic will show if a requirement is allocated to two functions. This could later cause a race condition and problems that likely won’t be found until much later in the project.
The analogous visual to the Hierarchy Diagram is the System Modeling Language (SysML) Requirements Diagram. This diagram also comes directly from the repository and follows the modeling language specification. This feature is a boon to a company that is highly interested in Systems Modeling Language.
Views from the repository become more numerous and detailed as the design develops, revealing the next level of complexity. A Physical Block Diagram, as described in One Model Many Interests, Many Views, by David Long and Zane Scott (July 2017), shows components drawn as nodes or graphics and labeled with the block name and number. As the authors explain, connections—either logical interfaces or physical links—are represented as lines between nodes. An unconnected interface or link is often drawn as an un-terminated line reflecting an open connection. To look at this from a data perspective, it requires a “built from” relationship and a “joined to” interface to show the relationship. As the design becomes more complete, the interface is comprised of a link which transfers an item. This is all shown visually.
On my wife’s office bookshelf is a new book called Visuals Matter—the result of an experiment on the impact of visuals on both cognition and communication in portfolio decisions, and how these can be used successfully to enhance business. In my experience as an engineer, visuals matter in every phase of our work—from start to finish. While language is important too, the human brain processes information better when the text is wedded to a clear picture. CORE has been leading the way in this visual market for over 25 years of testing, tweaking and schema reliability. It’s “art” I can vouch for!


