


Architecting
Architecture is an interesting aspect of system design. As systems thinkers, we know that the behavior of the system is the result of the interactions of the components of the system with each other and the interactions of the system with its environment. These interactions are defined by the structure of the system and the environment in which the system exists. In some cases, the architecture emerges from the pieces that are put together to create a solution. In other cases, it is designed from the system requirements and behavioral definition along with clear architectural objectives. It has been my experience that it happens more often as the former rather than the latter.
There really is no issue with the architecture being defined in either way. The common problem with building from the pieces is losing focus on the architectural objectives and the characteristics of the system that may be affected by the structure. These objectives can vary wildly. Weight, number of connectors, number of signals, assembly requirements, timing constraints, bandwidth, reuse, and testability are all examples of constraints that may drive decisions in the composition of the architecture. Almost anything that can be a constraint on the system behavior or system characteristics can be assigned as architectural constraints as well.
In part 1 of this blog, I will take you through an example that will look at one particular architectural objective that drove the discussion of two different physical architectures. You will get to see what these different architectures look like in N2 diagrams. I will then review the potential impacts on the system. In part 2, I will take you through the behavioral architecture.
The System of Interest
The example that I will be discussing is an automotive vehicle corner management system. This is a generic example. I do not intend to get into the specifics about what is being managed at the corner of the vehicle but to use it to discuss two different types of architecture (a centralized management system versus a distributed management system). Each corner of the vehicle will require one sensor and one actuator to perform a behavior at the corner and the system requires one central sensor and actuator to fulfill the full system behavior.
Driving Objective
The primary reason driving the discussion of these different architectures is a constraint to minimize the wiring in a vehicle. There are two primary factors of wiring that are of concern (weight and cost). Copper is heavy and expensive. Reducing the overall wire usage could improve fuel economy/range and reduce cost.
One other constraint kept in consideration in this example is assembly. The corners of the vehicle will be assembled independently and then assembled into the vehicle.
While the objectives are clear, the question becomes which architecture is better suited to achieve the goal and what other impacts might it have.
Centralized Architecture
In this architecture, the system is centered around the centralized system management controller. The controller connects to the central sensor and actuator through the central harness. The central harness plays a key role in connecting the system controller to each corner as well. The corners are then comprised of a sensor, actuator, and a corner harness. The corner harnesses exist to allow the corners to be assembled before assembling into the vehicle where they can then be connected to the central harness.
Here is what it looks like in the Physical N2 diagram:
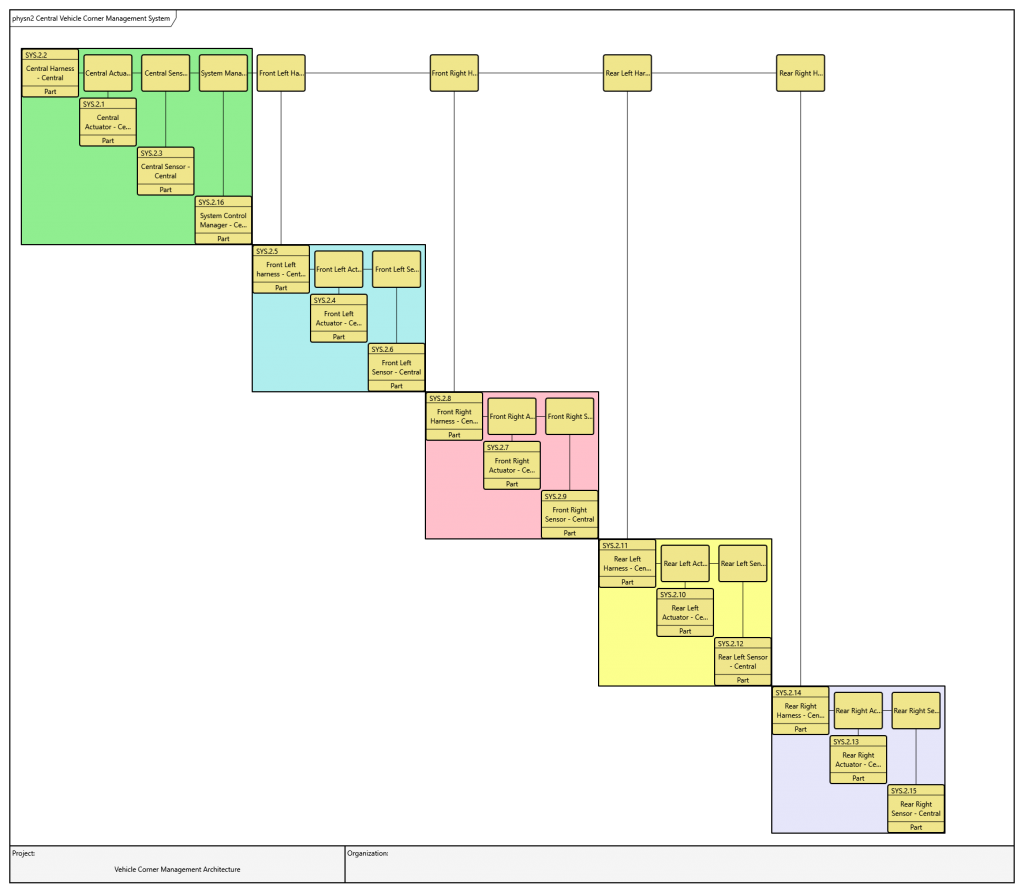
In a Physical N2 diagram, the physical parts of the system are depicted down the diagonal of the chart. The connections between the parts are then depicted off the diagonal at the intersection of two parts showing only a line to indicate that there is a connection present between the two parts. There is no directionality associated with the connection. In this example, you can think of the connections as a mated pair of connectors between each harness and each part. The colored boxes that I have added to the drawing are done to indicate potential sub-systems in the overall system and it indicates which connections are inside the sub-system boundaries. The connections outside of the colored boxes indicate connections between the sub-systems. The colored boxes show how an N2 diagram can be used to organize the structure of your components based on the connections or location in the system.
Distributed Architecture
In the distributed architecture, each corner has an independent management controller that manages the sensor, actuator and communications for the corner. The controllers are connected through a network router to receive power and communicate with the central management system. The concept here is that a simpler three or four wire connection of power, ground and communications can replace the five wires required to connect the corner. The reduction of one or two wires may seem insignificant for this simple system but in reality, the corner systems are much more complicated than just a single sensor and actuator so there would be many more wires involved.
Here is what that looks like in the N2 diagram:
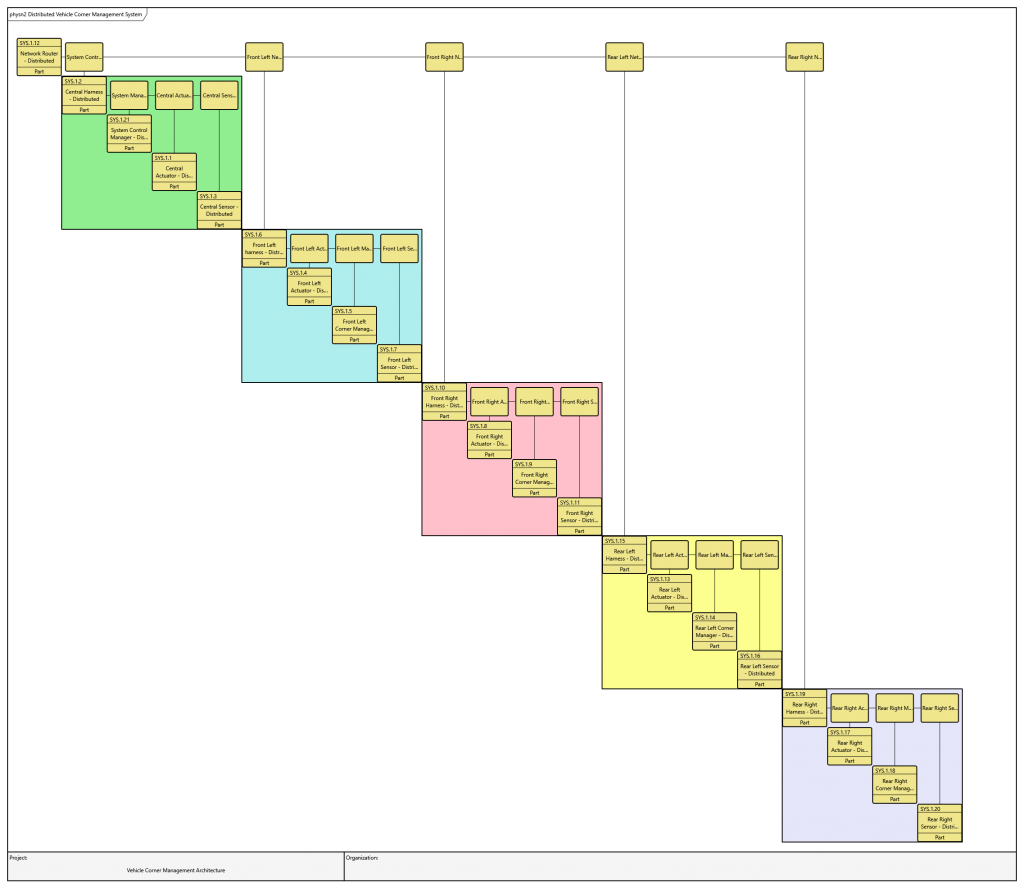
It is not much different. You have the Network Router at the top as a standalone component and it interfaces to the same sub-systems as in the centralized architecture. In each corner system, a management controller has been added.
Analysis
The simple analysis for now will be purely based on the number of parts and connections.
- Centralized System
- Parts: 16
- Controllers: 1
- Sensors: 5
- Actuators: 5
- Harnesses: 5
- Mated Connectors: 15
- Parts: 16
- Distributed System
- Parts: 21
- Controllers: 5
- Sensors: 5
- Actuators: 5
- Harnesses: 5
- Router: 1
- Mated Connectors: 20
- Parts: 21
From here, we can start to consider the potential impacts. The number of connectors and the associated pins will impact harness weight/size/cost and connector weight/size/cost. Off loading some functionality from the system management controller may impact its weight/size/cost. The addition of 4 controllers and the network router will impact overall weight/size/cost.
While weight/size/cost are the primary characteristics of the physical components that will be impacted, some additional impacts that need to be considered are reliability of the system, testability, and assembly impacts.
As I stated above, the reduction of one or two wires might not justify a distributed architecture. It might make more sense for a more complicated system. But, what has not been considered is the individual wires/signal. These will be included as part of the behavioral analysis. In part 2 of the blog, I will review the behavioral analysis including the signals, Behavioral N2 diagrams, and the potential impacts of the architectural differences.


