


The Full Analytical Criteria Method (FACM) is derived from the work of Dr. Thomas Saaty and others on the Analytical Hierarchy Process (AHP). AHP uses a 9-point scale to evaluate a large number of alternative solutions against each other with respect to a single criterion at a time. It accommodates a large number of decision criteria by using the same 9 point scale to evaluate the relative importance of the criteria and assigning weights to those criteria based on the outcomes of the comparisons. The various alternatives can then be processed repetitively one criterion at a time and the results synthesized using the weights assigned to each criterion. As complex as it sounds, the power of AHP is in the use of one-to-one (head-to-head) comparisons.
FACM streamlines the AHP process and makes it well suited for use by a group (e.g.- a design team) while preserving the power of the head-to-head comparisons. This is done by using a 5-point comparison scale and by combining the FACM with other creativity and decision tools to generate the alternatives and identify the selection criteria to be used. Tools like traditional brainstorming or brain writing are used to generate ideas and are coupled with prioritizing techniques (e.g.- Nominal Group Technique, Dotmocracy) to refine the results into a useable list of alternatives or criteria. The goal is to limit the alternatives and criteria to be analyzed to lists of five or fewer. This culling of alternatives, along with the use of the simpler 5-point scale, makes FACM a useful and manageable decision process for almost any group.
NOTE: The root value of FACM lies not in the numbers and rankings generated by the process. The principal value resides in the discussion of the alternatives and criteria as they are systematically compared and contrasted with each other. The comparisons elicit exactly the right information and analysis for the group to use in thinking about the choices and the decision to be made.
Technique
Matrices: FACM uses a series of matrices to organize and preserve the comparisons. The number of criteria selected for the process determines the number of matrices used. The first matrix is used to weight the criteria. Then each criterion is used in a separate matrix to compare the alternatives to each other on the basis of that criterion. Finally, the results of each criterion evaluation comparison matrix are compiled and weighted with the respective criterion weights established in the first matrix and the results synthesized in a final matrix. Therefore, there is always the number of criteria plus two matrices (one matrix per criterion plus the criteria weighting matrix plus the final synthesis) used in a FACM process.
Scale: FACM uses a five-point scale to compare criteria or alternatives. The scale (with the appointed values) is: Much more (important/performance) (10 pts); More (important/performance) (5 pts); Equal (1 pt); Less (0.2 pts); and Much Less (0.1 pts).
Process: The first step is to use a divergent thinking tool to generate the possible criteria to be used in making the decision. Most of the time in a large group setting this will be traditional brainstorming or a modified version of it (e.g.- Nominal Group Technique (NGT)). Smaller groups may want to explore tools such as brain writing to generate the list. The list of possible criteria generated are then subjected to evaluation using a convergent group tool such as dot voting (Dotmocracy) with the goal of trimming the list to five or fewer criteria that will actually be used in the FACM analysis.
Next a divergent thinking tool is used to generate a list of alternative solutions to be evaluated. The alternatives generated in this way can be modified or combined to develop the best possible list of candidate solutions. This list is trimmed in the same way as the criterion list to five or fewer alternatives for the final analysis.
With the two lists in hand the group is ready to begin the actual FACM process. The first matrix to be developed is the criteria weighting matrix.
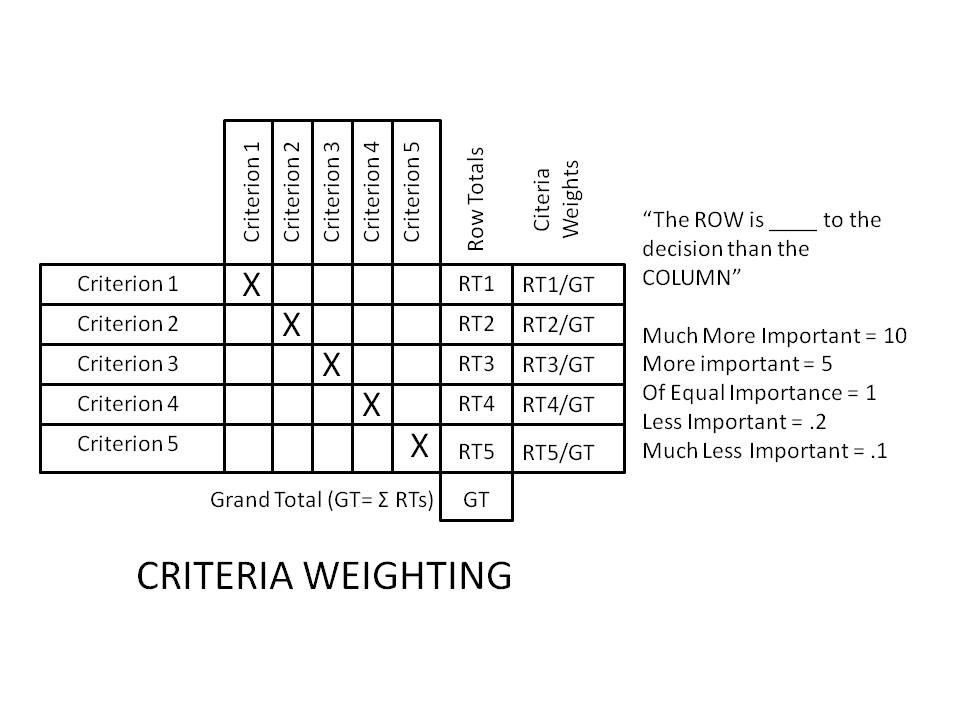
The criteria are listed (in no particular order) across both axes of the matrix (down the left side and across the top). Note the diagonal with the boxes “Xed” out. This is because no criterion is never compared to itself. The analysis proceeds by comparing Criterion 1 to Criterion 2, then to 3 etc. It is important that the ROW is compared to the COLUMN consistently throughout in order to avoid “scrambling” the values in a given row and distorting the later totals. The numerical values are then systematically entered for all of the comparisons. (Note that for all the inverse comparisons (e.g.-C1 to C2 and C2 to C1), the values in the two boxes are the reciprocals of each other. This stands to reason because, if C1 is “more important” than C2 yielding a (5), then C2 is “less important” than C1 yielding a (.2)- the reciprocal of (5). It can be helpful to actually run these comparisons manually in order to surface any inconsistencies in thinking which might be masked if a spreadsheet program is used to autofill them based on the first comparison.)
The values in each row are then totaled. The resulting row totals are added together producing a “Grand Total.” By dividing each row total by the grand total, the criteria can be weighted in a manner reflecting their relative value to the decision process (expressed as decimal values which sum to one or percentages which sum to 100%).
Similarly, a series of matrices are constructed (one for each criterion) with the alternative solutions listed across the axes to set up the same head-to-head comparison process. Each of the matrices would look like this:
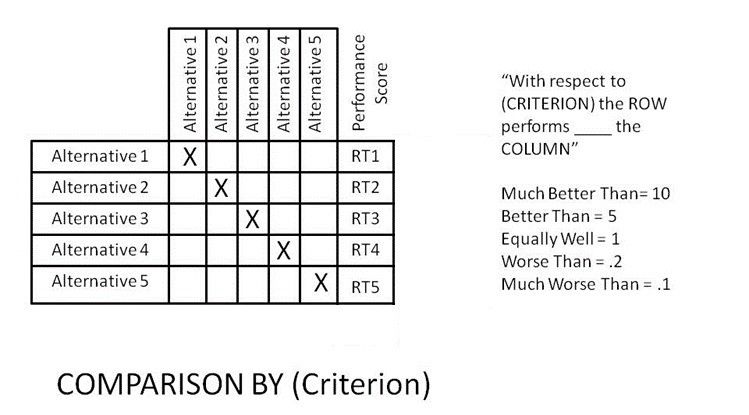
The comparisons proceed in the same way as in the criteria weighting. This time the statement to be completed is “With respect to (the criterion involved in this matrix), the row is _______ than the column.” The statement is completed by choosing one of the options. (Much Better Than, Better Than etc.) Again, by completing the statement from the legend with a comparison, the corresponding numerical value can be entered in the intersection box in the matrix. As in the discussion of the criteria weighting, the principles of reciprocity and logical integrity (Better/Worse; 5/.2) apply here.
These comparison discussions can/should be fueled by research. Even more than the comparisons of the “importance” of criteria to the decision, the performance of the alternatives with respect to the criterion being discussed may well be ascertainable. The discussion process will surface the need for information. Sometimes the process may even be halted or rerun based on this need.
Once the comparisons are made to the group’s satisfaction, the same process of getting row totals applies here as it does in the criteria weighting. The numbers that are generated are the relative performance scores of the various alternatives.
One final matrix is used to draw the comparisons together.
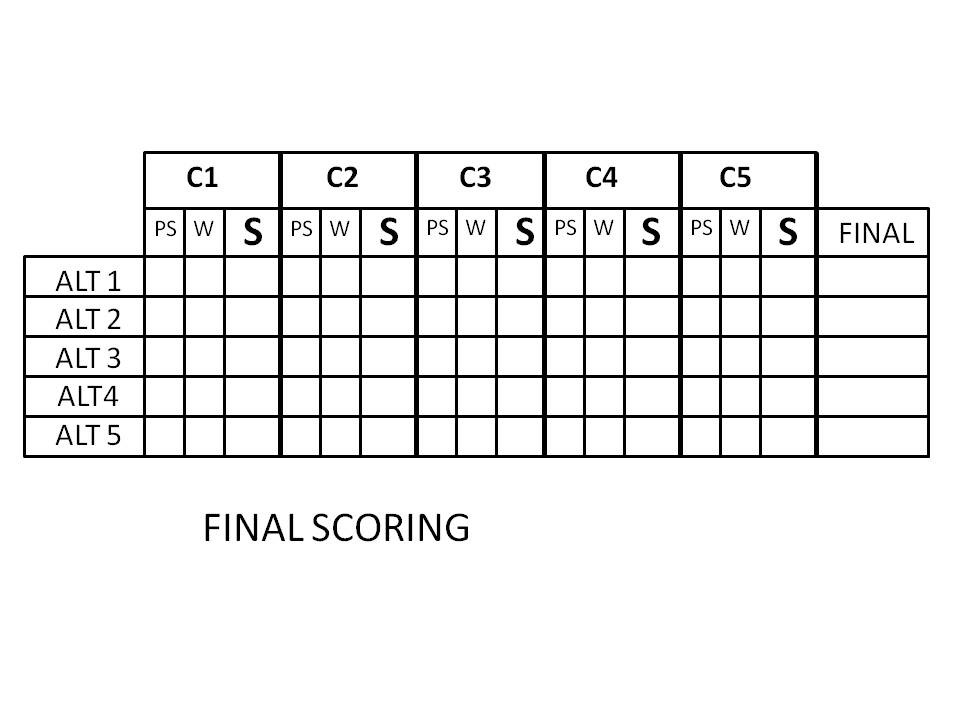
In this matrix the values arrived at in the other scorings are aggregated to arrive at a final comparison of the alternatives. The Performance Scores (PS) from the Comparison by Criterion matrices are entered for each alternative. Then the Criterion Weights (W) are listed for each criterion (the same value is entered in each row of the “W” column for a particular criterion). The Score (S) is computed by multiplying the performance score by the criterion weight [PSxW=S]. The scores are summed for each alternative (row) to get a final score [Σ S(C1 . . . C5)= FINAL]. The alternatives can now be ranked in order of their performance under the weighted criteria by ordering them from high score to low score.
Notes: The final scoring matrix embodies the rationale of the group. It reveals where alternatives rose and fell. (e.g.- statements like, “Alternative 1 did well on criterion 3- far surpassing the others. But, criterion 3 was given very little weight so what appeared up front to be a sizeable advantage turned out not to carry much weight in the final analysis.”) Some participants have commented that the process and the matrices “write the report for you,” meaning that it is relatively easy to trace the scoring back to particular comparisons and, especially with good discussion notes, recall the rationale that led to critical elements of the final outcome.
It is equally important to note that the “final score” is not binding. The focus is on the discussion. When that discussion reveals that the process is flawed in some way (there are other criteria not being considered in the formal analysis etc.) it becomes perfectly acceptable to choose a different alternative (perhaps the “second” choice) or even to rerun the whole process altogether. The value of this tool is that it surfaces the right issues and airs them among the decision makers.
Hints and Tips:
It is the discussion of the comparisons (e.g.- “Is the Row better than the Column or is it much better? Why?”) that is the real “goody” in this process. It is in those discussions that the decision crystallizes.
If the spreadsheets are automated using a program such as MS Excel or Google Sheets, the related comparisons can easily be set up to automatically enter the reciprocal values thus automatically preserving the logical integrity of the comparisons. (But, note the value of recalculating the reciprocal relationship as a logic check for consistency as called out above.)
An automated spreadsheet can be set up to import the values for performance scores and criteria weights into the final matrix. Then, using formulae, the scores can be calculated and summed automatically producing the completed sheet without additional time or effort.
The group needs to see the comparison values as they make them. Seeing the values underscores the discussion of the comparison and the thought process behind it. They may or may not do this by seeing the actual matrix as it is filled in. Various facilitation processes can be used to complete the matrices. These can include projecting the actual spreadsheet matrices one at a time and filling the comparison values into them as they are elicited from the group discussion. The optimal solution turns on having a facilitator of the discussion who must elicit comments and analysis from the group while freed from the necessity of actually entering the data. This is easily done by separating the data entry role from the facilitator duties and facilitate in a team of two- one leading the discussion and the other running the spreadsheet. The goal of the process is to promote a rich discussion and allow the group to see what they are doing as they do it.
The method of taking the many-to-many nature of the selection process and dividing it into head-to-head comparisons not only simplifies the thinking but it fosters the thorough discussion of the considerations that go into the decisions. The process leads the group systematically through valuable discussions of the underlying decision and any logical inconsistencies that might emerge. This maximizes the value of the group’s time and effort and can lead them to a higher quality decision by sharpening their collective deliberations.
Note: It is much easier to instantiate the FACM into the group’s processes if it is initially led by an experienced facilitator. The author is willing to discuss this possibility with any reader who sees a need for the FACM in their team decision-making practices.


