

The main purpose of a systems engineering tool is to augment the work of the systems engineer by providing a framework in which to construct a model of the system. This helps in two major ways. It allows the tool to do the record keeping, assuring the consistency and completeness of the model. In addition, it frees the engineer to do the work of actual design and it makes it possible for the tool to autogenerate and maintain the variety of views into the model data that are the way the engineer can communicate into and out of the model. We like to say that with GENESYS, the tool does the bookkeeping and you do the engineering.
Ever since its introduction in 2011, Vitech’s GENESYS has been designed with those two purposes in mind. With the shipment of Release 2 of the 2020 version, GENESYS has taken a significant step forward in its communication power.
GENESYS has always been able to use its metamodel-organized repository to autogenerate views of its model, reflecting changes to the data in real time. Leveraging the model structure, GENESYS produces views at the touch of a button by querying the repository for the desired information for a particular diagram, table, report or other representation and generating the specified view according to the rules that govern its format.
By using the view both as a way of representing the requested information currently in the model (outbound communication) and as a way of accepting changes to the information through changes to the view (model construction), GENESYS is able to maintain the model in real time so that any request for a view reflects the changes made up to the time of the request—even as they impact other views. The power to make a change in one view and see it immediately and automatically propagated throughout the model is one of the key advantages of using GENESYS.
The latest release of GENESYS has taken this advantage to a new level. It has always been possible to make some stylistic modifications and customizations of diagrams. For example, nodes depicted in a diagram could be altered in color to draw attention to some special characteristics or to tailor the view to the needs of a particular audience. But this release has extended that capability in a number of ways.
NOTE: The description that follows does not describe how to effect the changes. For an understanding of that, please watch the release webinar for GENESYS 2020 R2.
Now, it is possible to change the shape of nodes on the diagram by choosing from nine different geometric shapes. The borders of nodes can be modified in thickness and color. The templates that control the content of diagram nodes can be altered to present only the content needed for your communication purpose. You can also control the font formatting in those templates to use bold, italic or strikethrough text where that may be helpful.
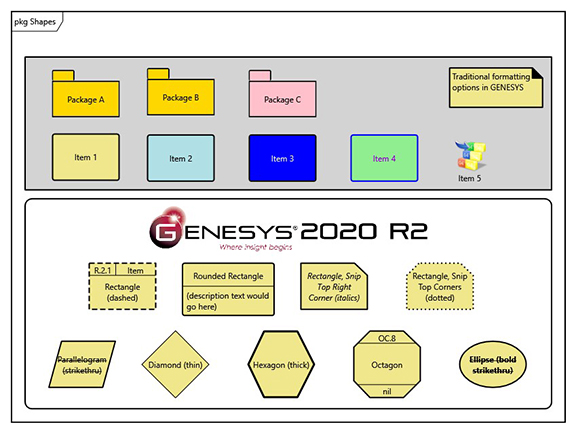
Figure 1. View of shapes, borders, text formatting
Another powerful addition to the GENESYS communication arsenal is the ability to hide (elide) content on a diagram. Sometimes, showing the complete content of a diagram may confuse or overcomplicate the information that is being conveyed. In that case, GENESYS now supports selecting diagram content to be hidden. This is accomplished using “Presentation Modes.” The “Standard” mode displays all of the content that is defined as having engineering relevance for a particular view. The “Marked” mode shows the information selected for elision in a “grayed out” state so that an engineer can look at the diagram information and be aware of what will not be shown in either of the two remaining modes. (See Figure 2.)
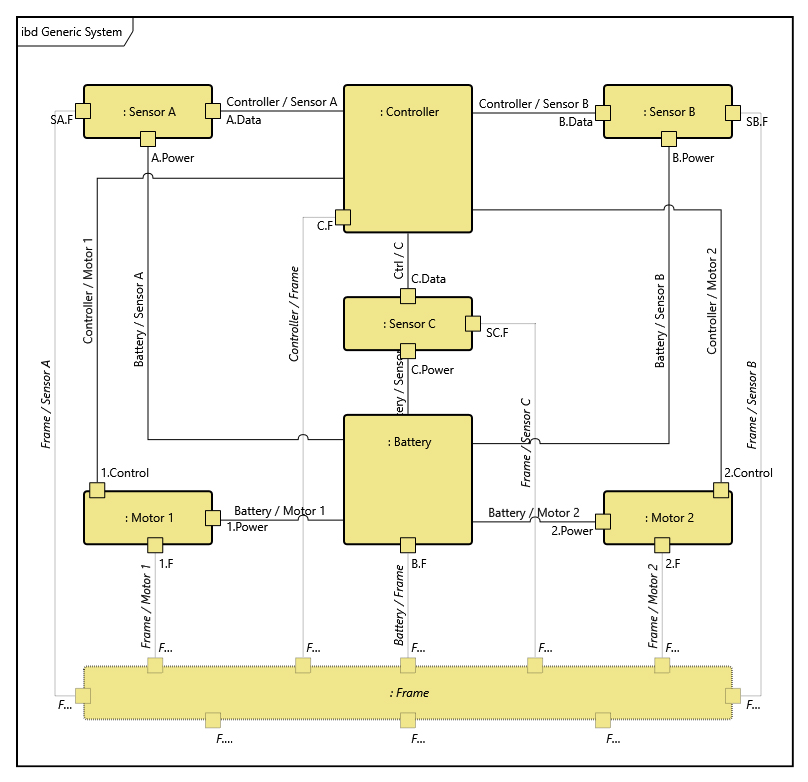
Figure 2. Elided material in Marked Mode
In the “Hidden with Label” mode, the diagram is displayed without the elided material but carries a label at the top indicating that the diagram has information that has been hidden. The final mode, “Hidden,” simply displays the diagram without the hidden information. (See Figure 3.) You can choose from these presentation modes the one best suited to your communication needs in a given instance.
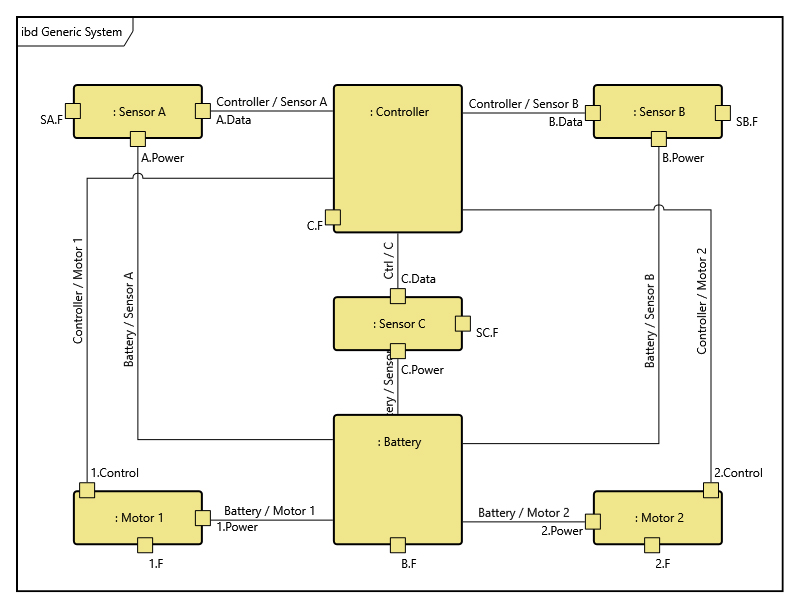
Figure 3. Same view as 2, but with data hidden
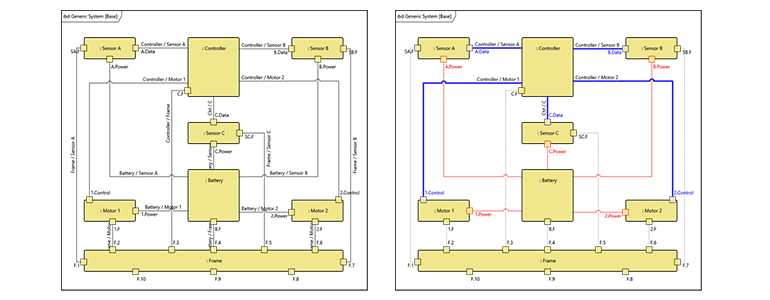
These manually executed formatting and display options add richness to your communication, but the latest release doesn’t stop there. The truly powerful next step is accomplished by using rules as a basis for the diagramming changes. This enables rich visualizations without the repetitive effort of item-by-item modifications.
The easy-to-create rules can specify that a diagram be produced with a particular, user-defined set of modifications. Rules are defined using drop-down selections (no code required!) to take effect at a choice of diagram, node, or line level. The power of display modifications is magnified by using the rules to implement the changes across a set of views or nodes or lines.
For example, you can decide that all nodes representing a particular class—like functions—should be parallelograms. Or, you might decide that the “or” circles in “select” control constructs should be represented as diamonds to resonate with audiences more comfortable with decisions represented that way on flow charts. Perhaps you might use rules to display diagrams depicting developmental phases through modification of the nodes belonging to the different phases. The use of rules might also allow you to show different groupings of nodes (electrical, data, etc.). You can even set up the rules to be based on conditions by having them, for example, display all nodes that have outstanding diagnostic errors in red.
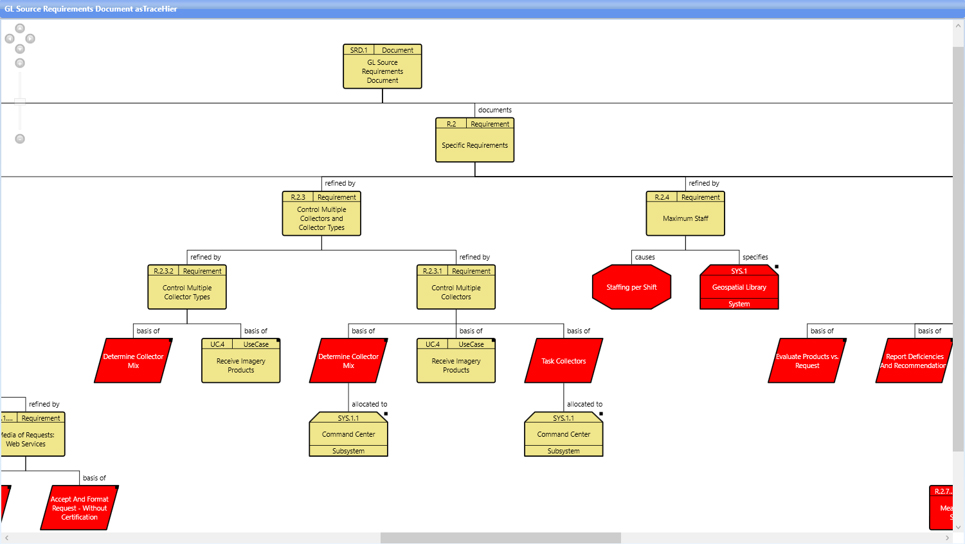
Figure 4. View with red parallelograpms
Whatever your purpose, by using a standard selection of pre-written rules or writing custom rules yourself, you can take advantage of the power of rule-based formatting to communicate using GENESYS.
Also included in the release is the ability to manage multiple views to depict a particular diagram type. For a given diagram type you could have one that showed the standard nodes of an engineering drawing and another that used images or icons in place of the usual boxes. This is easily done by customizing a view, naming it and then setting it as an option for that view.
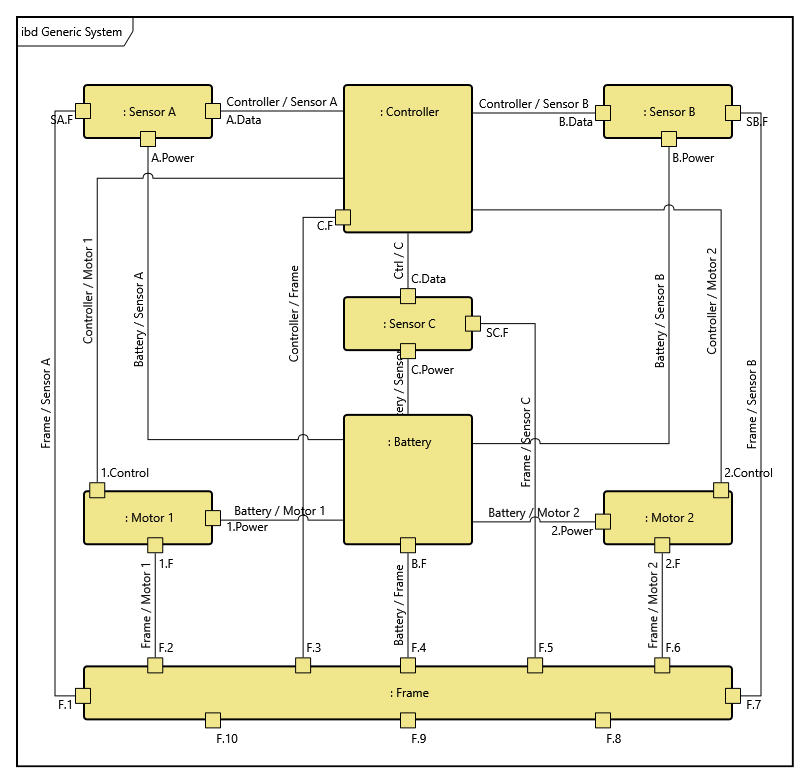
Figure 5. Regular BD diagram
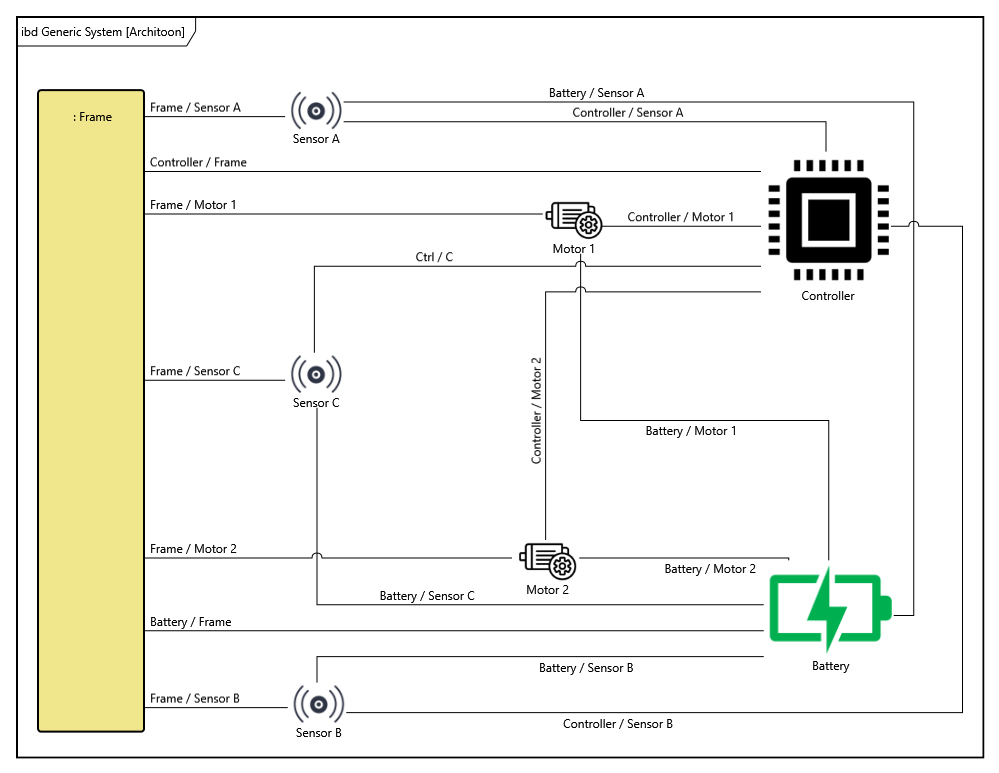
Figure 6. Architoon of the same BD diagram, above
These powerful new features add up to a significant increase in the already impressive communication ability of GENESYS. They are in keeping with our aim to free you to do the engineering while leaving the bookkeeping tasks to the tool. The power of GENESYS to use its proven data-structuring system metamodel assures that your model is complete and that it consistently underpins these latest innovations in visualization and communication. If you want to know more about the additional power of GENESYS don’t hesitate to watch the release webinar and/or contact us by emailing me at zane.scott@vitechcorp.com.
To find out more about the new features of GENESYS 2020 R2, check out the “What’s New in GENESYS 2020 R2” page.


